Zombie Apocalypse Graph
General Formula =
What does A and B do?
First of all, let's get to know our terminology; a, b and c are the parameters, and x and y are the independent and dependent variables. Where the x and the y are determine the shape of the function, parameters change the behavior of the graph. I wonder what they do? What if we only look at one of them at a time?
Parameters, or a, b and c, change the behavior of a graph or exponential pattern. For example, if you have a high number of the base rather than a higher A, the graph will increase more rapidly than if A were to start of extremely large.
x = variable
y = variable
a = constant
b = coefficient
c = coefficient
What happens when you change the values of A, B and C?
For example, if you have 7 zombies and they can infect 2 humans each day, then although you have a large number of zombies to start with, the rate of infection is smaller, so in the end the growth would not be as much as if you started with just 1 zombie, but each zombie could infect 10 people a day.
(Not to forget about C, but he's not really useful in the context of zombies, as all he does is move the graph line up and down on the axis, and does not effect the steepness of the graph unlike a and b.)
Click on the images to find out more.
constant


What does C do?

As you scroll through the images, you can see that all the value of C does is move the exponential line up and down on the axis. It can go up and down on the y axis, and also on the x axis.
On the picture, the value of C = 0.
On the picture, the value of C = 0.

Value of C = 5

Value of C = 10
General Notations
x = number of zombies worldwide
y = time (days)
a = multiplier
b = base
c = initial number, or starting number
y = time (days)
a = multiplier
b = base
c = initial number, or starting number
Notations in context to zombies
(For this zombie example, we're just going to ignore C, because it doesn't really work in this context)
x = the total number of zombies worldwide.
y = the amount of time it takes for people to be infected
a = the quantity of zombies at 0, e.g. already 10 zombies at start of 2050
b = growth rate, for example are the amount of zombies per day doubling, tripling, etc. If the number of zombies p/d (per day) was doubling, then b = 2. If it were tripling, then b = 3, and so on.
Specific Notations to form an apocalypse formula!
Lets say there are a starting number of 5 zombies deciding to infect the world, with a population of roughly 7,240,000,000. By the time you have read this I'm sure it will have increased greatly, but we can use at as a rough estimate. How long would it take for the entire world to become infected by zombies?
|
x = variable
y = variable a = 5 b = 3 |

|
What these notations mean is that there are 5 zombies to start with on day one. They can only infect 3 people each in one day (so the growth rate is tripling)
Solve a simpler problem
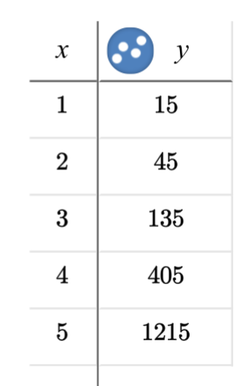
Instead of solving the amount of time to infect the entire world, let's start with a simpler problem. How long will it take to infect all of the Vatican City, with a population of 800?
By Day 1, the zombies have already infected 15 people. Why? Because there were 5 zombies to start with, and each zombie infected 3 people each that day. And remember:
a = 5
b = 3
How do we work out how many people are infected by day 1? To work this out, we use the formula.
b = 3
How do we work out how many people are infected by day 1? To work this out, we use the formula.
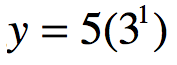
Yey! By copying the notations into the formula, we can now work out how many people will be infected in the Vatican City by day 1.
3 to the power of 1 = 3 x1, = 3. 3x5=15.
So know we know that by day 1, 15 people have become zombies!
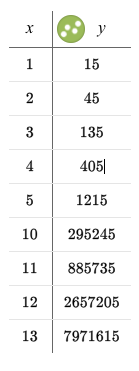
When we put our results in a table using the same formula as shown if you scroll up a bit, you can see that somewhere between day 4 and day 5, the entire population of Vatican City will be infected! Now we are ready to try something more challenging. But first of all, can we make predictions?
3 to the power of 1 = 3 x1, = 3. 3x5=15.
So know we know that by day 1, 15 people have become zombies!
When we put our results in a table using the same formula as shown if you scroll up a bit, you can see that somewhere between day 4 and day 5, the entire population of Vatican City will be infected! Now we are ready to try something more challenging. But first of all, can we make predictions?
We can make predictions
We can use the same formula for each different day. For example, we know that by day 20, there will be 40,000 infected zombies, because we use the same formula and the same format as we used to calculate the number of zombies on day 1. We use this formula to predict any number of zombies on any day:
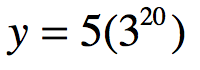
This notation is specific to how many zombies there will be by day 20. You can tell because the 20 is up there floating around in space so that we can go 3 to the power of 20. Now let's work it out:
y = 5 x 3,486,784,401, which is equal to:
17,433,922,005
So this number of zombies in the world by day 20 is roughly 17.4 billion, so a bit too much, as the world population is only roughly 7.1 billion people!
Now for the entire world population!

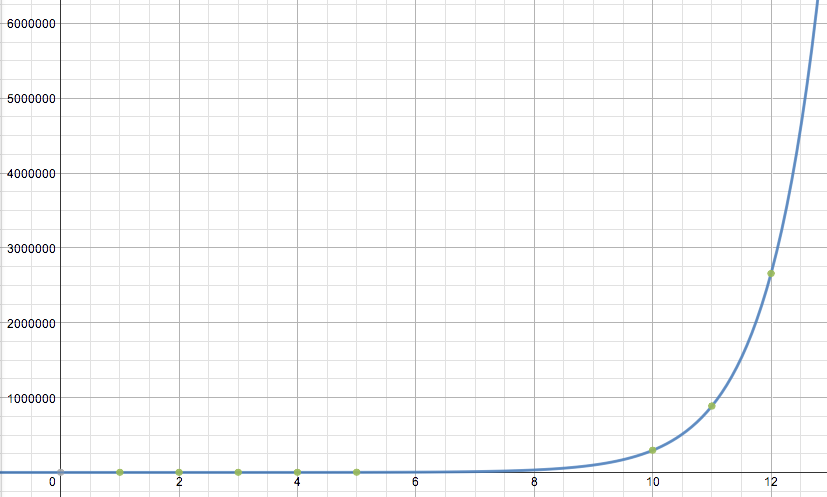
Using the graphing tool of Desmos, I was able to create a table, as seen above. I find tables a helpful way to see patterns in numbers. But for now, by looking at days 12 and 13, we can tell that the entire world becomes infected between those days, as on day 12 there are roughly 2.7 billion people infected, and by day 13 there are roughly 7.9 billion people infected. As the current world population is around 7 billion, we know that the entire world population would be infected by day 13.
I didn't bother to calculate up to day 20, as we know that that was way too many zombies for the world population.
Wow! That was super quick! Why? Because it's exponential growth, and the growth increases rapidly. (Exponential decay is the opposite)
You can see the different plotting and growth on the graph (made on Desmos) below. As you can see, the growth increases extremely rapidly, and looks exponential.